Scenario
You are a business development manager reporting to the vice president (VP) of business development at one of the largest life sciences organizations in the Midwest.
You are working with the strategic planning team to assess the current data to make recommendations to its board of directors regarding the organization’s exit strategy.
You have started creating your plan for the organizational change and selected members for the guiding coalition. Your next task is to help determine the value of the organization’s assets to the potential acquirer.
One of the core strengths of the organization lies in the value of its talent. Potential buyers in this industry want to know that the organization that they acquire is going to be able retain their valuable employees.
So, the VP has asked you to analyze the human resource data in order to determine what the organization is worth. This includes taking a close look at the organization’s human resources, analyzing the attrition data, and making predictions about employee stability in case of an acquisition.
The organization has been collecting information about its employees since its inception in 1999; this information has been organized in a spreadsheet. In order to understand recent trends in your organization’s workforce, you will analyze this employee data.
Your analysis will look at employee attrition and retention and will be included in your report. This will provide a clear picture of your organization’s workforce to help anticipate its perceived value with potential buyers.
Prompt
First, use the employee attrition data to create visuals in Tableau that capture the trends and possible reasons for retention and attrition in the organization from the course scenario. Then, write a report about the current state of human resources and attrition.
Include screenshots from your visualizations to support your report. Remember to consider the employee’s employment status when visualizing and analyzing the data. The Status column in the spreadsheet indicates whether the employee is a current or
former employee of the organization.
Specifically, you must address the following criteria:
Guidelines for Submission
Submit a 5- to 6-page Word document using double spacing, 12-point Times New Roman font, and one-inch margins. Sources should be cited according to APA style. Consult the Shapiro Library APA Style Guide for more information on citations.
Guidelines and rubric
Employee retention is a very vital yet expensive exercise in every organization. It will be more expensive to hire and train new employees than to retain the existing ones who already have experience in their respective roles. Employee attrition implies losing employees through retirement, resignation, retrenchment, or firing (Alduayj & Rajpoot, 2018).
Talents are very scarce, and one of the organization’s exit strategies was to examine the likelihood of retaining valuable employees. This report determines some of the factors that lead to employee attrition to aid in strategically drawing plans to maintain the employees of the life science organization.
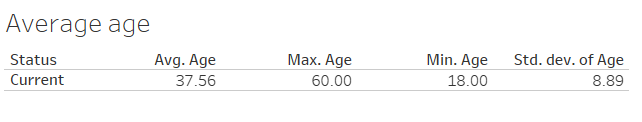
Age
According to the given dataset, the age distribution is shown in Table 1. Analysis showed that the average age of the current employees was approximately 38 years. The youngest employee in the organization was 18 years while the oldest was 60 years old, with a standard deviation of 8.89 years.
Table 1: Age
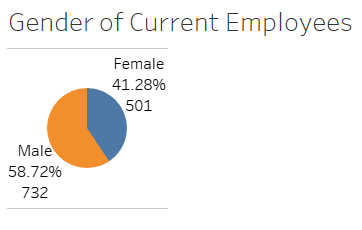
Gender
The organization does discriminate on gender during employment. Employees are hired based on their ability to handle their tasks to achieve the organization’s set goals and objectives. According to Figure 1, the number of males employees, around 58.72% (n = 732), was slightly higher compared to females, 41.28% (n = 501). A pie chart was suitable in this case to visually represent nominal groups, which aids the investors and willing buyers to quickly asses gender distribution in the organization.
Figure 1: Gender
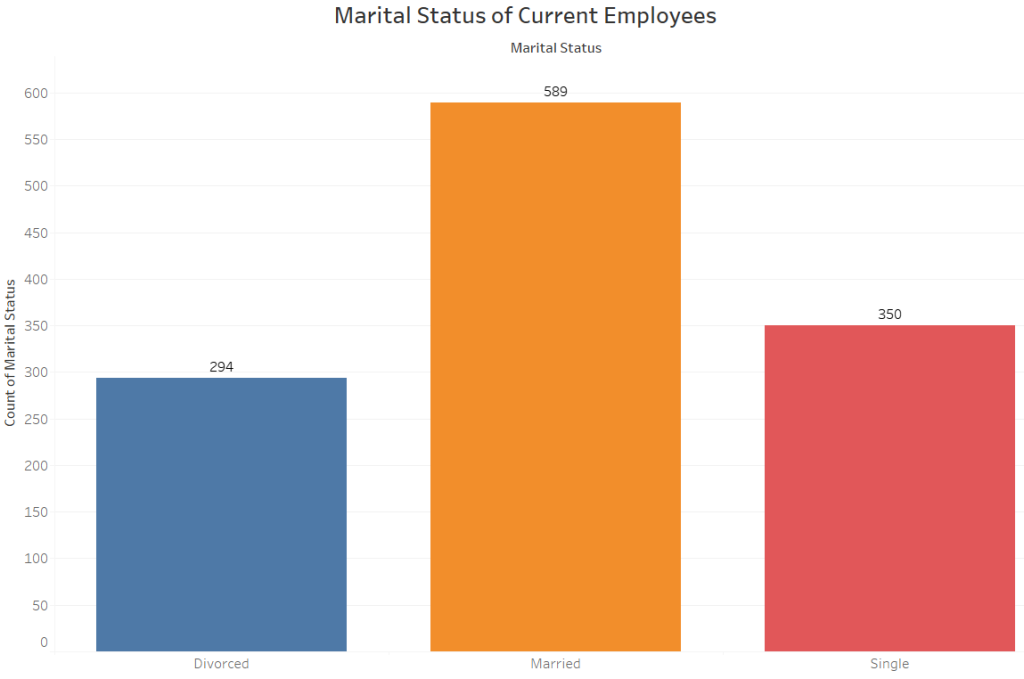
Marital Status
Figure 2 shows the analysis of the marital status of the organization’s employees. According to the study, about 294 employees reported having divorced, while 589 were married and 350 were single. This can be a significant determinant to examine the mobility of every employee when the need arises.
A column chart was utilized since it shows the distribution of employees in the three marital status categories. One can easily compare the groups accordingly to make well-informed decisions.
Figure 2: Marital Status
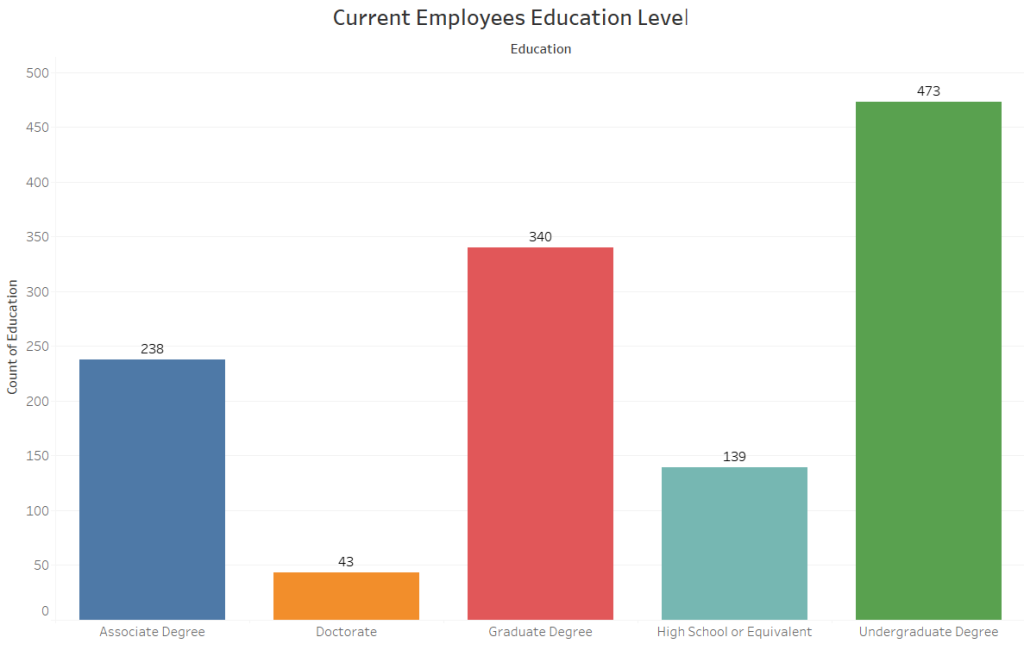
Education Levels
Education is one of the most significant factors to consider during tasks assignment and promotions. Those with higher education levels are expected to be more skilled in their respective fields and can handle tasks with less supervision.
According to Figure 3, most current employees (n = 473) hold undergraduate degrees, followed by graduate degrees (n = 340). Those with associate degrees were 238, and high school level was 139. The least was in the doctorate category (n = 43). A column chart best represents the counts in every education level and efficiently helps build comparisons between groups.
Figure 3: Education level
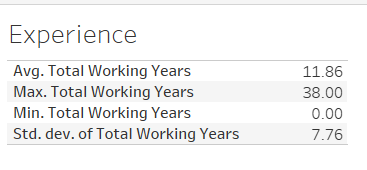
Working Experience
The organization will need to retain those employees with the highest work experience in terms of years. The higher the level of working experience, the more reliable an employee is since she/he is used to the tasks assigned.
Table 2 shows the descriptive statistics of the employees’ working experience. According to the analysis, the average number of years of working experience for an employee in this organization is approximately 12 years. The highest work experience is 38 years, while some have no work experience. The descriptive analysis gives a clear description of the variable of interest and aid in making further analysis.
Table 2: Work Experience
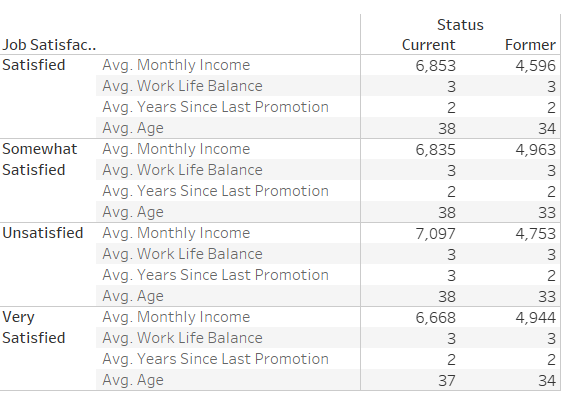
Several reasons may contribute to employee attrition. These may include salaries, job satisfaction, the years and employee spent since the last promotion, and work-life balance, among other factors (Singh, 2019). Table 3 gives the relationships between some factors that lead to employee attrition.
An employee’s monthly income can be a significant factor in decision-making on staying in the organization. Those with higher incomes are more likely to stay than those with low incomes. According to the analysis, the current employees have higher average incomes than those who left the organization. Age can also determine employee attrition.
Older employees may retire, while an organization may also decide to retain those with higher work experience. Job satisfaction is an excellent factor in employee attrition. More satisfied employees are more likely to retain their positions in the organization. At the same time, those who are less satisfied will tend to look for new opportunities in environments that favor them.
The years employees have spent since their last promotion can determine whether the employee will still work for the organization and she/he will resign. Employees who are promoted lately and frequently are more likely to stay in the organization than those who stay for long without promotion.
The work-life balance of an employee significantly affects retention ability. Some employees reported a low work-life balance (1), while others reported a high one (4). Employees with low work-life balance are more likely to leave than those with higher work-life balance.
Table 3: Top 5 reasons for attrition
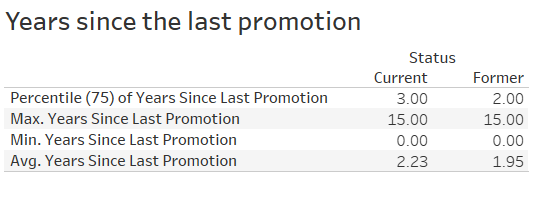
Employees who left the organization have approximately two years since their last promotion. Around 75% of the former employees have less than two years since their last promotion, according to the analysis in Table 4.
Table 4: Years since the last promotion
Analysis was conducted to determine the age at which an employee leaves the organization. Table 5 shows the analysis. According to the analysis, the average age of a former employee is 33.61, approximately 34 years.
Table 5: Summary of Attrition
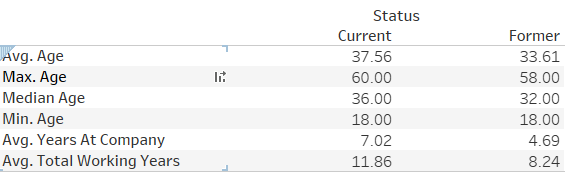
After how many years does an employee leave the organization?
According to Table 5, the average years spent in the company was approximately five years. According to the dataset, an employee spent close to 5 years before leaving the organization.
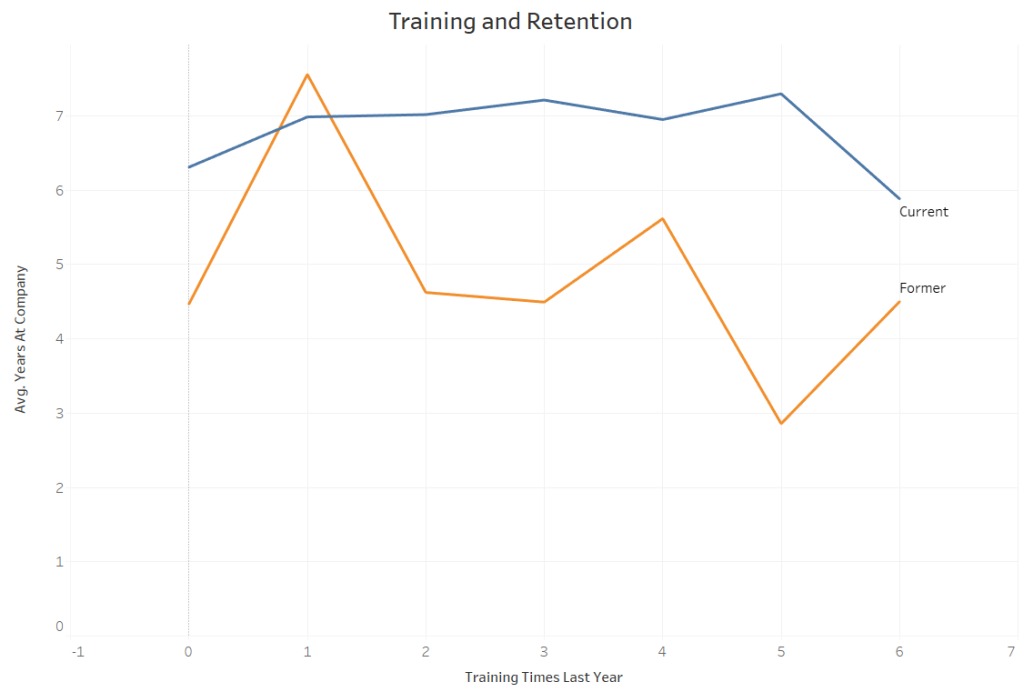
The connection between the number of times a person was trained, how long they stayed at the organization, and whether they left.
It is expected that employees who receive more training are more likely to stay as the organization will require them for their more skills impacted by the training. Figure 4 shows the relationship analysis between the number of times employees were trained, how long they stayed, and whether they left.
According to the analysis, those who were not trained stayed for the least number of years. Those who received one training stayed in the organization for the highest number of years. A drop was observed as the number of trainings increased for the employees who left.
Figure 4: Training and retention
According to the analysis, the current employees are less likely to leave compared to. Looking at the various factors such as employee income, the current employees have more average income than former employees. This might be why the former employees left, and the organization has done enough to ensure they do not lose employees based on income.
Analysis showed that the organization had allocated the necessary strategies to ensure employee stability in their respective organizational roles. Looking at the trends, the current employees have maintained more stable curves in every aspect, such as training and the number of years they worked for the organization.
Employee retention ensures that particular skills and talents remain in the organization. Job satisfaction is one of the significant impacts in ensuring that employees are retained. An increase in the employee’s income can increase the job satisfaction score; hence, the organization will have more chances of retaining their employees.
The analysis showed that the number of years since the last promotion of an employee was higher in the current employees compared to the ones that left. Continuous promotions can lead to high chances of retaining an employee.
Employees can stay hopeful that their chances of topping the management are higher. These promotion opportunities have many advantages and prestige; most would like to stay in a good environment.
The work-life balance is vital to every employee. For an employee to maintain the state of equilibrium, the employer must allocate most resources to ensure a conducive environment for their employees (Wood et al., 2020).
Continuous training on maintaining personal life and work should be a priority for the organization. Team building will be a good strategy for the organization to optimize employees’ performance socially.
Reference
Alduayj, S. S., & Rajpoot, K. (2018, November). Predicting employee attrition using machine learning. In 2018 international conference on innovations in information technology (iit) (pp. 93-98). IEEE.
Singh, D. (2019). A literature review on employee retention with focus on recent trends. International Journal of Scientific Research in Science and Technology, 6(1), 425-431. https://www.researchgate.net/publication/331306592_A_Literature_Review_on_Employee_Retention_with_Focus_on_Recent_Trends
Wood, J., Oh, J., Park, J., & Kim, W. (2020). The relationship between work engagement and work-life balance in organizations: A review of the empirical research. Human Resource Development Review, 19(3), 240-262.
(SOLVED) MBA 699 Milestone Three
Delivering a high-quality product at a reasonable price is not enough anymore.
That’s why we have developed 5 beneficial guarantees that will make your experience with our service enjoyable, easy, and safe.
You have to be 100% sure of the quality of your product to give a money-back guarantee. This describes us perfectly. Make sure that this guarantee is totally transparent.
Read moreEach paper is composed from scratch, according to your instructions. It is then checked by our plagiarism-detection software. There is no gap where plagiarism could squeeze in.
Read moreThanks to our free revisions, there is no way for you to be unsatisfied. We will work on your paper until you are completely happy with the result.
Read moreYour email is safe, as we store it according to international data protection rules. Your bank details are secure, as we use only reliable payment systems.
Read moreBy sending us your money, you buy the service we provide. Check out our terms and conditions if you prefer business talks to be laid out in official language.
Read more